
Processor Internals
Instructions and OpCodes
Let’s take a look at a really small, bare-minimum test program written in Arduino C++.
Note: This snippet is for demonstration purposes only.
You can find the full runnable version on
GitHub
const unsigned long C_LOOP_COUNT = 3000000;

// some setup

void loop()
{
    unsigned long loopCounter = C_LOOP_COUNT;
    unsigned long startTime_ms = millis();
    while (loopCounter-- > 0) {
        if (loopCounter == C_LOOP_COUNT / 2) {
            // some operations
        }
    }

    unsigned long endTime_ms = millis();
    unsigned long total_ms = endTime_ms - startTime_ms;

    // show results
}
Basically, the program loops 3 million times, using a counter to stop execution when it reaches zero. The if statement inside the loop is executed once and serves only one purpose: to prevent an empty loop. Without this, the compiler would detect that the loop does nothing and simply optimize it away.
When you press Compile, the Arduino IDE generates files compatible to the processor used, here ATmega328P:
- An ELF file: your compiled program, including debug information (like which lines generated which opcodes).
- A HEX file: a stripped-down, minimal version that gets uploaded to your Nano.
If you have AVR tools installed, you can easily disassemble the ELF file using:
avr-objdump -d -C /YOUR-DIR/your-program.ino.elf > disasm.txt
The file content will look like this:
while (loopCounter-- > 0) {
3c8:	81 e0       	ldi	r24, 0x01	; 1
3ca:	c8 1a       	sub	r12, r24
3cc:	d1 08       	sbc	r13, r1
3ce:	e1 08       	sbc	r14, r1
3d0:	f1 08       	sbc	r15, r1
3d2:	8f ef       	ldi	r24, 0xFF	; 255
3d4:	c8 16       	cp	r12, r24
3d6:	d8 06       	cpc	r13, r24
3d8:	e8 06       	cpc	r14, r24
3da:	f8 06       	cpc	r15, r24
3dc:	79 f0       	breq	.+30     	; 0x3fc <main+0x14a>
if (loopCounter == C_LOOP_COUNT / 2) {
3de:	80 e6       	ldi	r24, 0x60	; 96
3e0:	c8 16       	cp	r12, r24
3e2:	83 ee       	ldi	r24, 0xE3	; 227
3e4:	d8 06       	cpc	r13, r24
3e6:	86 e1       	ldi	r24, 0x16	; 22
3e8:	e8 06       	cpc	r14, r24
3ea:	f1 04       	cpc	r15, r1
3ec:	69 f7       	brne	.-38     	; 0x3c8 <main+0x116>
Disassembling
How do we read this?
Easy:
First download the AVR instructions set documentation from
https://ww1.microchip.com/downloads/en/DeviceDoc/AVR-InstructionSet-Manual-DS40002198.pdf.
And now let’s dive in OpCodes decrypting:
3c8:	81 e0       	ldi	r24, 0x01	; 1
3ca:	c8 1a       	sub	r12, r24
Because our first opcode is ldi r24, 0x01, we locate LDI in the documentation.
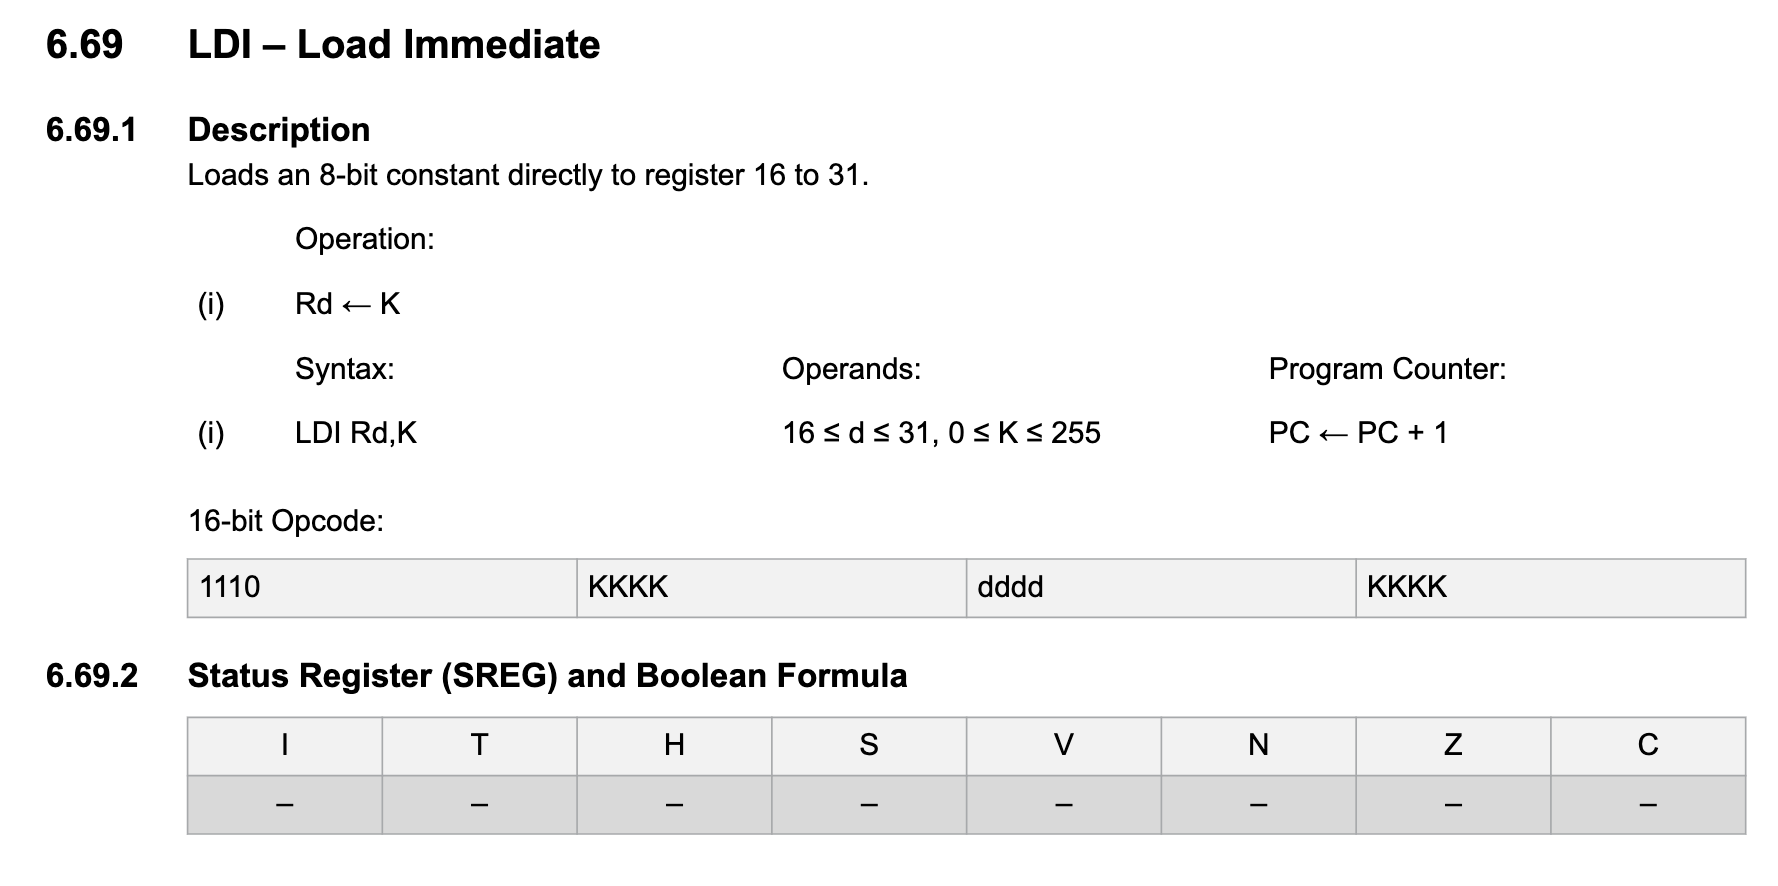
We see that this opcode assigns the value 1 to register r24, and importantly, it does not affect any status flags (indicated by -). After this assignment, the Program Counter (PC) is incremented by 1, moving from address hex 3c8 to 3ca.
Wait a second — isn’t 3c8 + 1 = 3c9? Correct, but on AVR, the PC counts in words, not bytes. One word is 16 bits (two 8-bit bytes), so each increment advances by 2 bytes in memory. Sometimes, the PC moves by 2 words (4 bytes) — for example when executing opcodes like CALL or JMP.
Similar to the AVR we will look at 3ca next and see SUB.
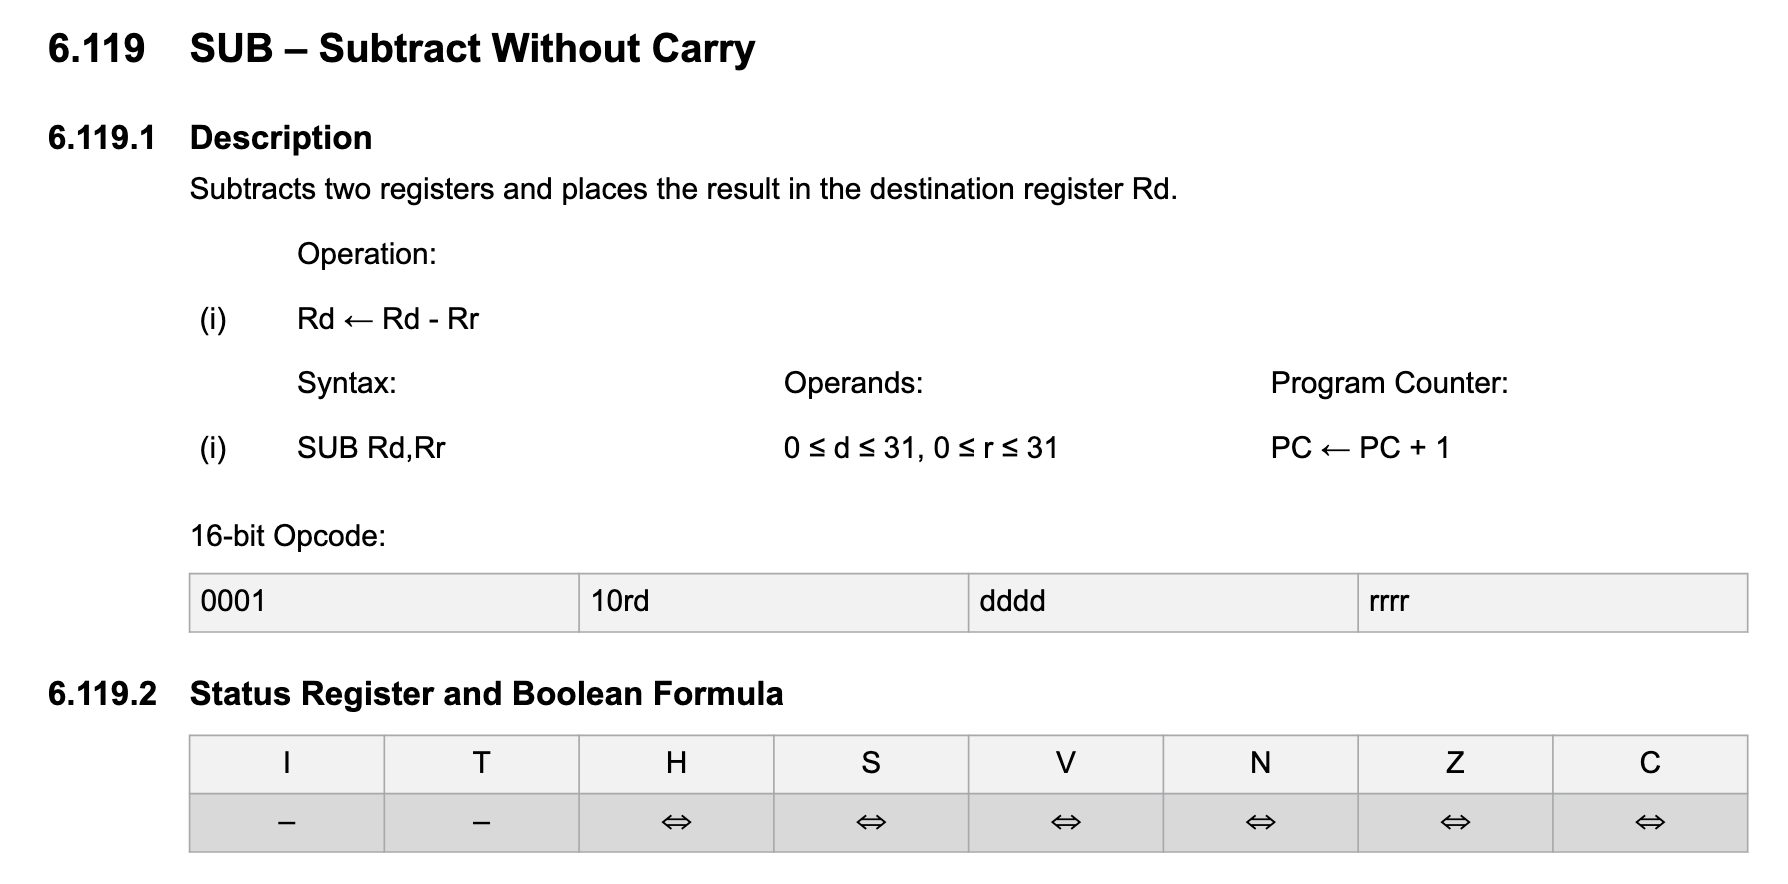
What happens here — sub r12, r24 — is that the value in register r24 is subtracted from the value in register r12, and the result is stored back into r12. Since we previously loaded r24 with 1 using LDI, this operation effectively decrements r12 by 1. Whatever value was in r12 before now gets reduced by one, and this updated value stays in r12 for the next operation.
Cycles
We’ve already explained the core concepts like Processor Instructions and Cycles.
OpCode Cycle Count (Theoretically)
The AVR documentation even lists the cycle count for each opcode (see example excerpt below).
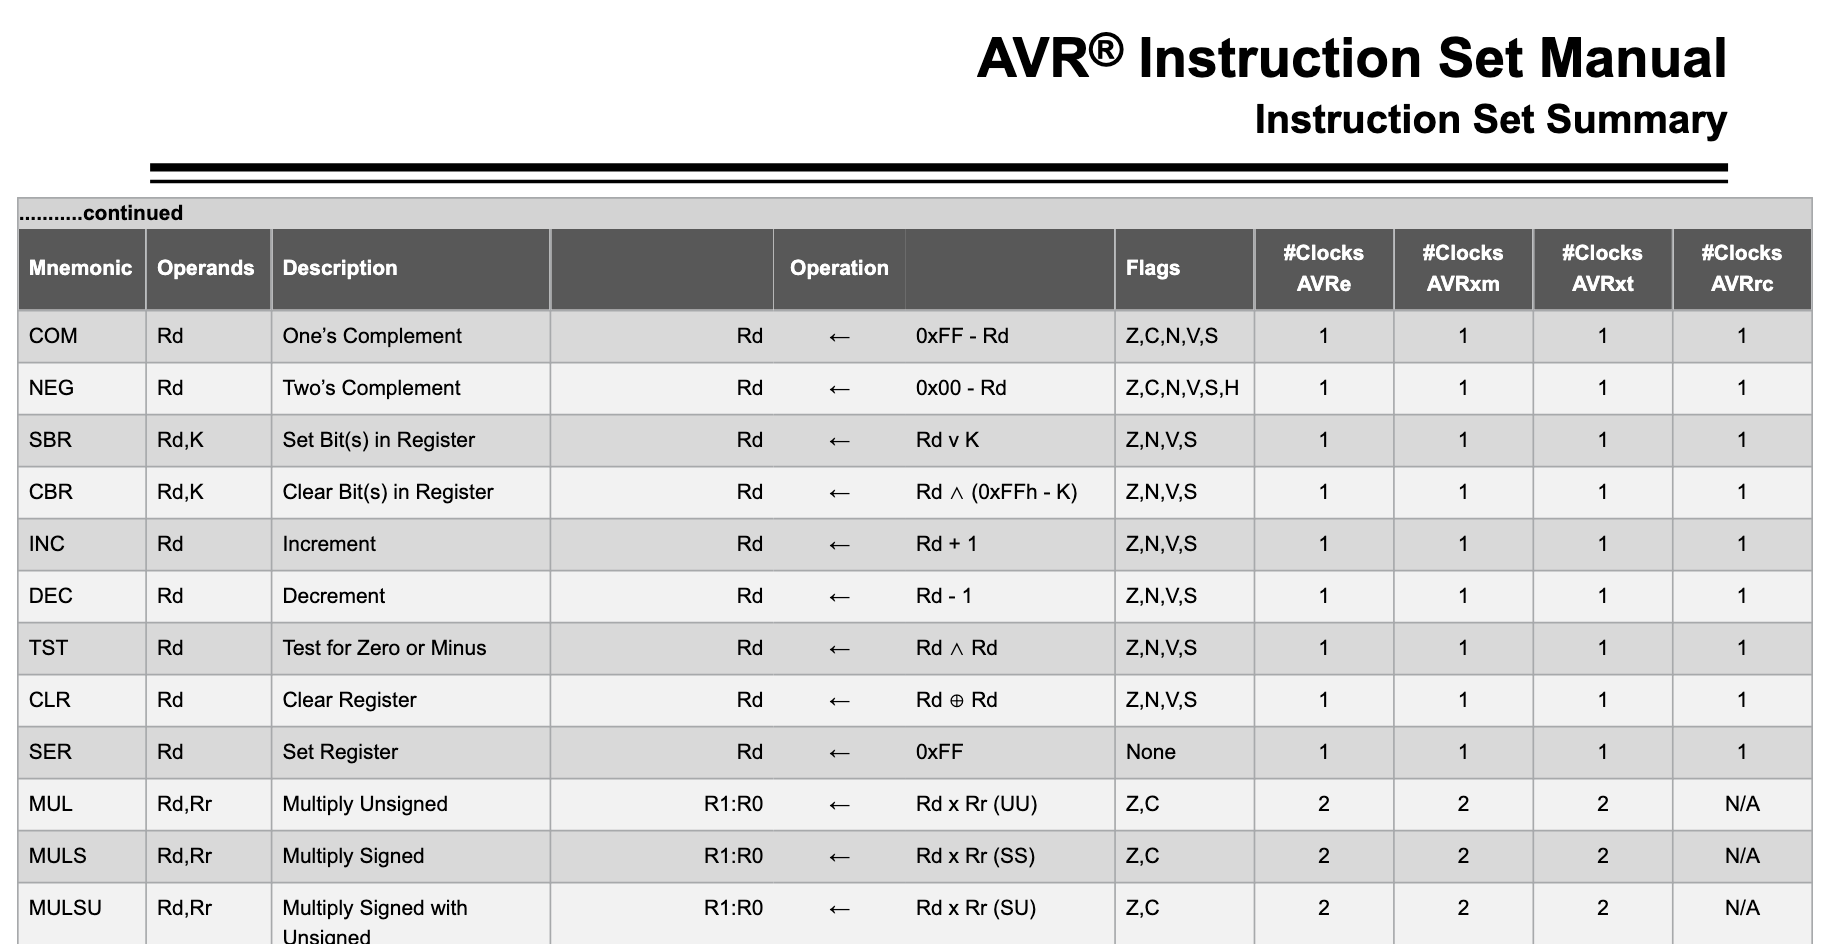
Now, using this information, we can calculate the total number of cycles for all the opcodes in our loop above…
| Address | Instruction | Mnemonic | Cycles |
|---|---|---|---|
| 0x3c8 | 81 e0 | ldi r24, 0x01 | 1 |
| 0x3ca | c8 1a | sub r12, r24 | 1 |
| 0x3cc | d1 08 | sbc r13, r1 | 1 |
| 0x3ce | e1 08 | sbc r14, r1 | 1 |
| 0x3d0 | f1 08 | sbc r15, r1 | 1 |
| 0x3d2 | 8f ef | ldi r24, 0xFF | 1 |
| 0x3d4 | c8 16 | cp r12, r24 | 1 |
| 0x3d6 | d8 06 | cpc r13, r24 | 1 |
| 0x3d8 | e8 06 | cpc r14, r24 | 1 |
| 0x3da | f8 06 | cpc r15, r24 | 1 |
| 0x3dc | 79 f0 | breq .+30 (branch if equal) | 1 if not taken, 2 if taken |
| 0x3de | 80 e6 | ldi r24, 0x60 | 1 |
| 0x3e0 | c8 16 | cp r12, r24 | 1 |
| 0x3e2 | 83 ee | ldi r24, 0xE3 | 1 |
| 0x3e4 | d8 06 | cpc r13, r24 | 1 |
| 0x3e6 | 86 e1 | ldi r24, 0x16 | 1 |
| 0x3e8 | e8 06 | cpc r14, r24 | 1 |
| 0x3ea | f1 04 | cpc r15, r1 | 1 |
| 0x3ec | 69 f7 | brne .-38 (branch if not equal, to 0x3c8) | 2 if taken, 1 if not |
…and we get 20 Air cycles per loop iteration. This allows us to estimate the expected runtime of our program:
3.000.000 [loop(s)] * 20 [cycles / loop] = 60.000.000 [cycles]
60.000.000 [cycles] / 16.000.000 [cycles / sec] = 3.75 [sec] = 3750 [ms]
OpCode Cycle Count (in Reality)
Actually, I don’t have a display or a serial port configured to send debugging messages. The reason? To keep the code size minimal and avoid introducing any hidden side effects.
So… how can we show the runtime of our program?
Enter “Morse Code” — DIY Debug Style!
Instead of classic Morse sequences of short and long signals, I use a dummy form of Morse code:
- First, send one long LED signal to indicate that a digit follows.
- Then, send a number of short LED blinks to represent the digit itself.
- We repeat this for each digit, moving from right to left.
This simple trick lets us “print” numbers using just the onboard LED — no additional hardware, no clutter, no hidden surprises.
while (total_ms > 0) {
    digitalWrite(LED_BUILTIN, HIGH);
    delay(2000);
    digitalWrite(LED_BUILTIN, LOW);
    delay(250);

    int blinkCount = (int)(total_ms % 10);
    for (int b = 0; b < blinkCount; b++) {
      digitalWrite(LED_BUILTIN, HIGH);
      delay(250);
      digitalWrite(LED_BUILTIN, LOW);
      delay(250);
    }

    delay(1000);

    total_ms = total_ms / 10;
}
DRUMROLL!
In theory we expected 3750 [ms], we measured 3771 [ms], that’s only 21 [ms] difference! A 21 [ms] delta over 3.75 seconds is just 0.55%, which is within expected bounds due to hardware and measurement imperfections.